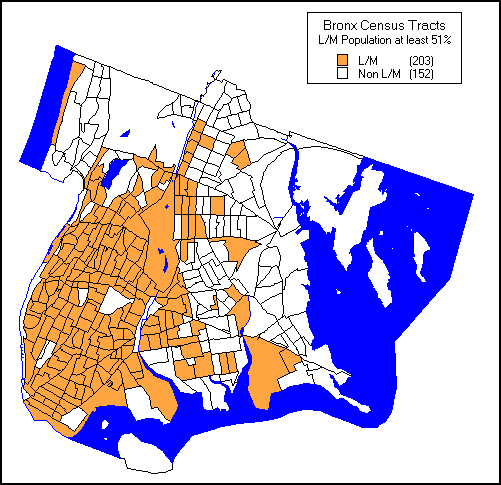
MAP 2 depicts Bronx census tracts of at least 51% low and moderate income.
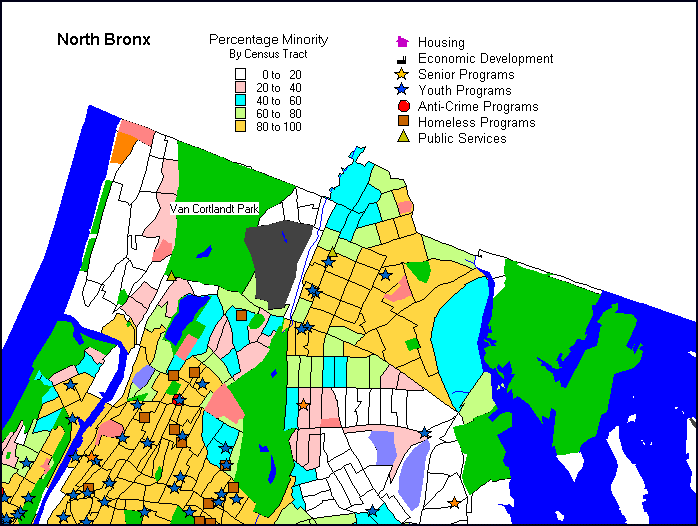
MAP 3 depicts percentage of minorities by census tract and proposed projects for the North Bronx.
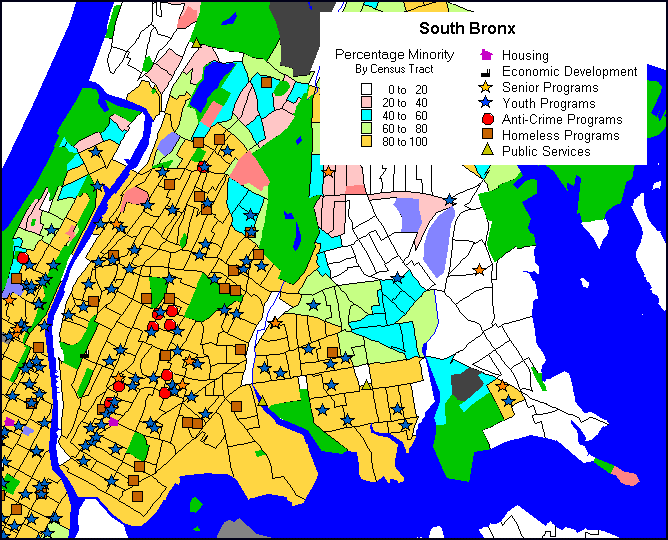
MAP 4 depicts percentage of minorities by census tract and proposed projects for the South Bronx.
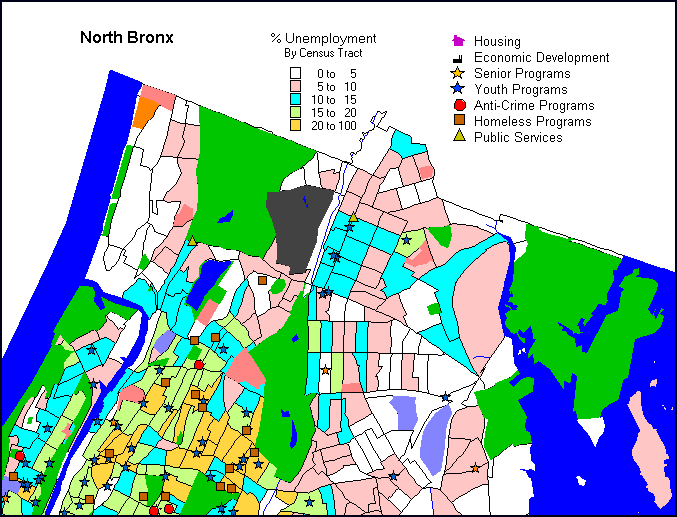
MAP 5 depicts percentage of unemployment by census tract and proposed projects for the North Bronx.
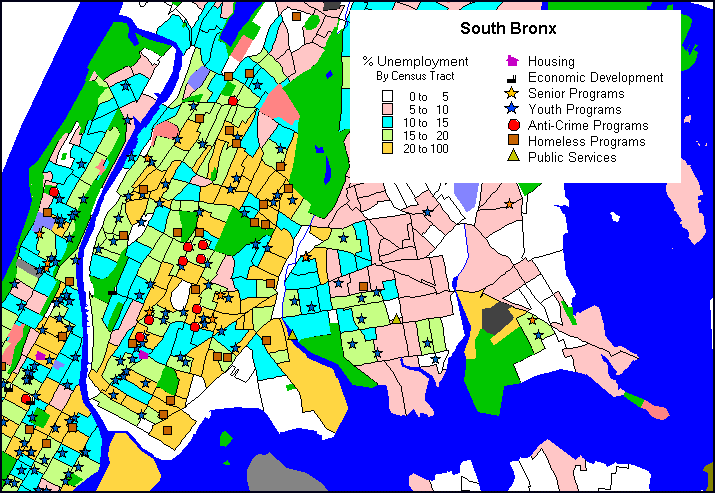
MAP 6 depicts percentage of unemployment by census tract and proposed projects for the South Bronx.